
Subscription Performance Dashboard
ProSee your subscription business health at a glance — performance cards, time-series charts, and product/customer leaderboards, all on the WooCommerce Analytics Overview page.
Availability: Pro
Page Navigation
- Current guide: Subscription Performance Dashboard Pro
- Where to open it: WordPress Admin -> WooCommerce -> Analytics -> Overview
- Direct route:
/wp-admin/admin.php?page=wc-admin&path=/analytics/overview - Section overview: Open overview
- Previous guide: Retention Analytics
- Next guide: woocommerce-analytics-extension
- Troubleshooting: Audits, Logs, and Troubleshooting
Overview
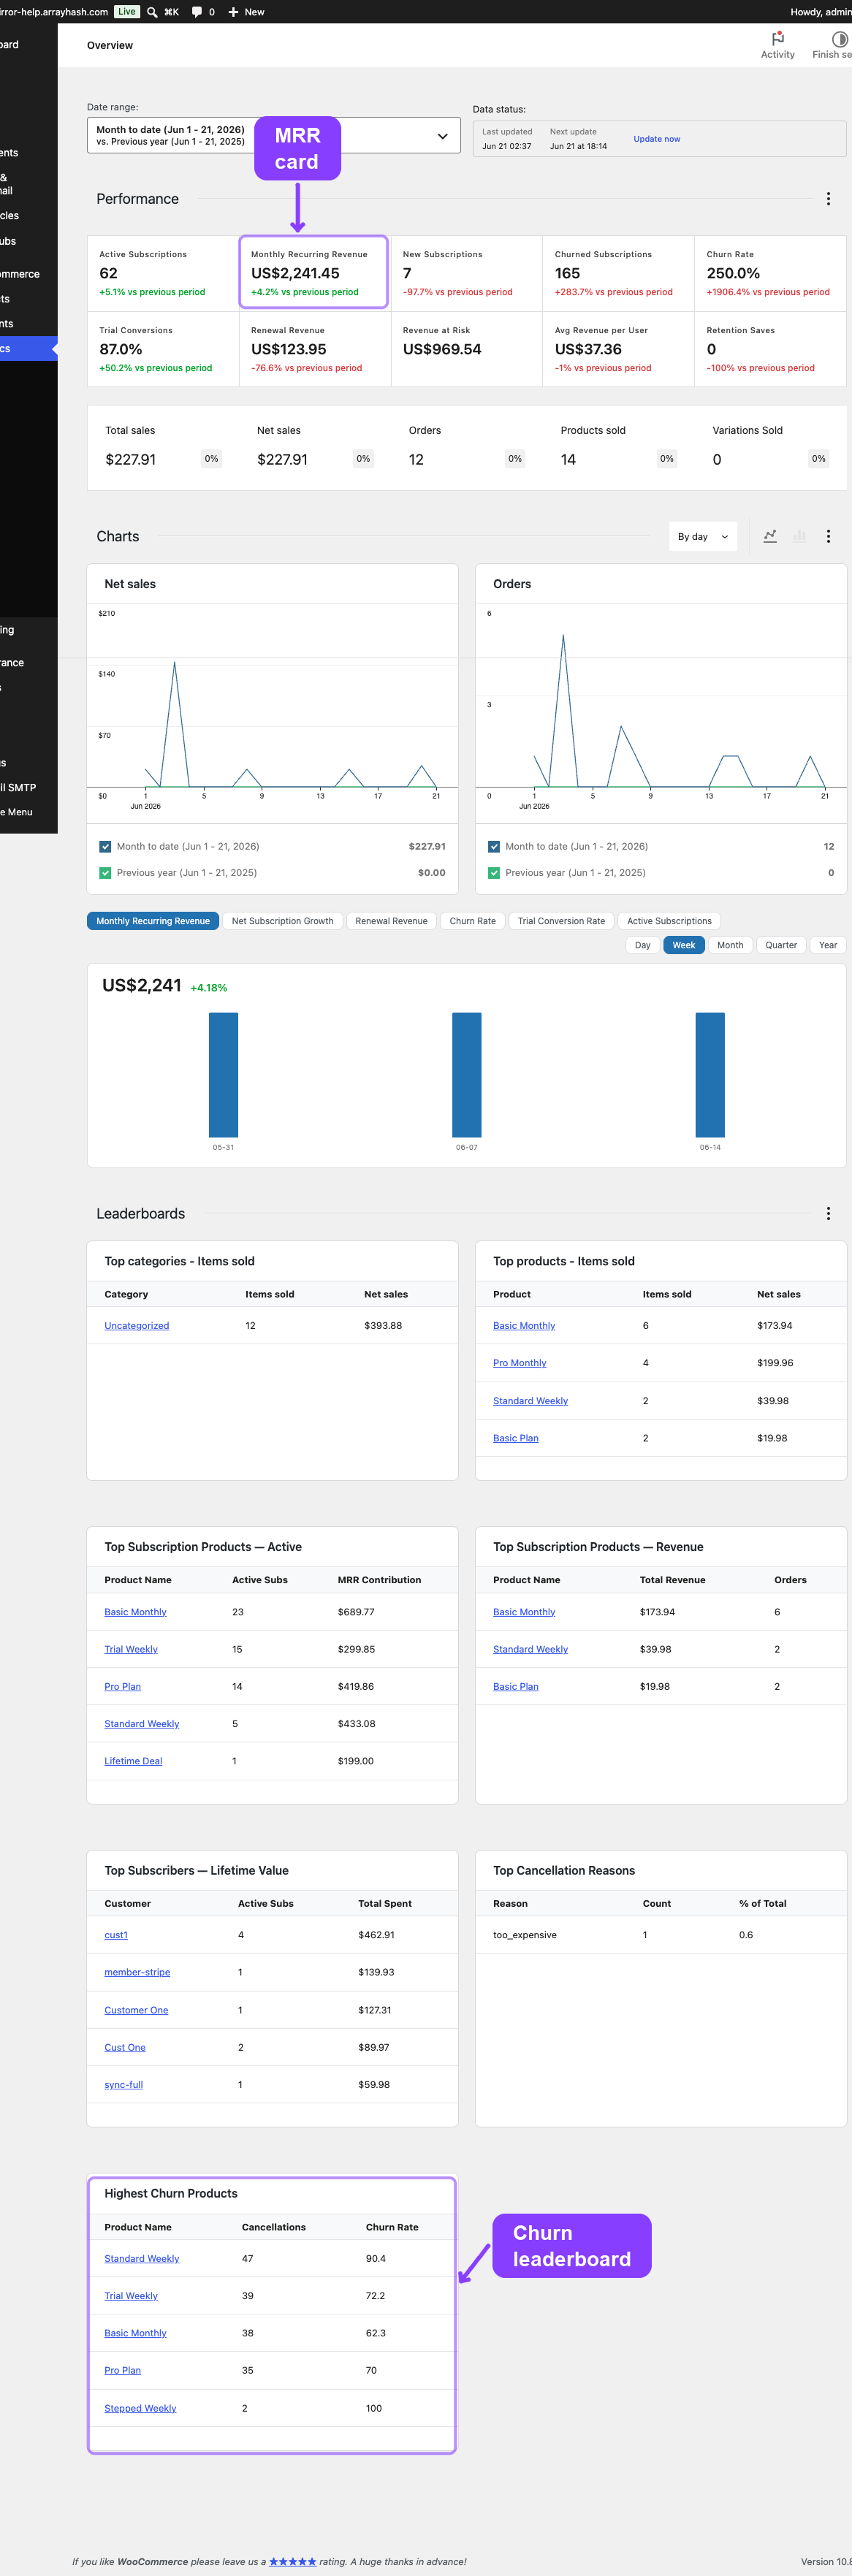
The Subscription Performance Dashboard adds three dedicated sections to the WooCommerce → Analytics → Overview page:
- Performance Cards — 10 key subscription metrics with period-over-period comparison.
- Subscription Charts — 6 selectable time-series charts that visualize trends over your chosen date range.
- Leaderboards — 5 ranked tables showing top products, customers, and churn reasons.
All sections respect the WooCommerce Admin date range selector and update automatically when you change the period.
When to Use This
- Review daily or weekly subscription health as part of your store management routine.
- Spot early signs of churn by monitoring the churn rate and revenue-at-risk cards.
- Compare trial conversion performance across time periods.
- Identify which products contribute the most recurring revenue.
- Present subscription KPIs to stakeholders without building custom reports.
How It Works
When you navigate to WooCommerce → Analytics → Overview, the dashboard fetches subscription metrics from the store's REST API and renders them above the standard WooCommerce dashboard sections.
Data is computed from live subscription and order records, then cached for 1 hour. The cache refreshes automatically when:
- A subscription changes status (activated, cancelled, on-hold, etc.)
- An order status changes (completed, processing, refunded, etc.)
The previous-period comparison is computed automatically. If you are viewing the current month, the cards compare against the previous month. If you select a custom date range, the comparison period has the same length and ends where your selected period begins.
Performance Cards
The dashboard displays 10 metric cards in a responsive grid at the top of the Overview page. Each card shows the current value, a percentage change versus the previous period, and a color-coded trend indicator.
Card Reference
| Card | Format | What it measures | Trend direction |
|---|---|---|---|
| Active Subscriptions | Number | Total subscriptions with active status whose start date is on or before the period end |
Higher is better |
| Monthly Recurring Revenue (MRR) | Currency | Sum of all active and trial subscription amounts, normalized to a monthly rate | Higher is better |
| New Subscriptions | Number | Subscriptions created within the selected date range | Higher is better |
| Churned Subscriptions | Number | Subscriptions cancelled within the selected date range | Lower is better |
| Churn Rate | Percent | Cancelled subscriptions ÷ (active at period start + new in period) × 100 | Lower is better |
| Trial Conversions | Percent | Trials that ended in the period and are now active ÷ total trials ended × 100 | Higher is better |
| Renewal Revenue | Currency | Total order value from all Subs Renew orders in the date range |
Higher is better |
| Revenue at Risk | Currency | MRR from on-hold subscriptions plus active/trial subscriptions with a pending cancellation | Lower is better |
| Avg Revenue Per User (ARPU) | Currency | MRR ÷ unique active customers | Higher is better |
| Retention Saves | Number | Retention offers accepted by customers in the period (from the Retention Flow) | Higher is better |
How MRR Is Calculated
MRR normalizes every active and trial subscription's recurring amount to a monthly equivalent using this conversion:
| Billing period | Formula |
|---|---|
| Daily | Amount × (30.44 ÷ interval) |
| Weekly | Amount × (4.35 ÷ interval) |
| Monthly | Amount ÷ interval |
| Yearly | Amount ÷ (interval × 12) |
For example, a $120/year subscription contributes $10 to MRR. A $25 every-2-weeks subscription contributes $25 × (4.35 ÷ 2) = $54.38 to MRR.
How Revenue at Risk Is Calculated
Revenue at Risk includes the normalized monthly recurring amount from:
- Subscriptions currently in on-hold status.
- Subscriptions in active or trial status that have a pending (end-of-term) cancellation scheduled.
This tells you how much monthly revenue could be lost if those subscriptions are not recovered.
Card Navigation
Most cards are clickable and navigate to a related WooCommerce Analytics page for deeper exploration:
| Card | Links to |
|---|---|
| Active Subscriptions | Orders report filtered by Subs Purchase + Subs Trial types |
| MRR | Revenue report |
| New Subscriptions | Orders report filtered by Subs Purchase type |
| Churned Subscriptions | Retention Analytics |
| Churn Rate | Retention Analytics |
| Trial Conversions | Orders report filtered by Subs Trial type |
| Renewal Revenue | Revenue report |
| Revenue at Risk | (no link — snapshot metric) |
| ARPU | Customers report |
| Retention Saves | Retention Analytics |
Subscription Charts
Below the performance cards, a tabbed chart section displays one time-series chart at a time. Select a tab to switch between six subscription metrics.
Available Charts
| Tab | Chart type | What it visualizes |
|---|---|---|
| Monthly Recurring Revenue | Currency | MRR at the end of each interval |
| Net Subscription Growth | Number | New subscriptions minus cancellations per interval |
| Renewal Revenue | Currency | Total renewal order revenue per interval |
| Churn Rate | Percent (lower is better) | Cancellation rate per interval |
| Trial Conversion Rate | Percent | Trial-to-paid conversion rate per interval |
| Active Subscriptions | Number | Active subscription count at the end of each interval |
Chart Intervals
The chart automatically selects the best interval granularity based on your date range:
| Date range | Auto-selected interval |
|---|---|
| 7 days or fewer | Daily |
| 8–60 days | Weekly |
| 61–365 days | Monthly |
| More than 365 days | Quarterly |
You can also select day, week, month, quarter, or year manually.
Each chart shows:
- A bar for every interval in the selected date range.
- A summary value for the current period.
- A delta percentage comparing the last interval to the equivalent previous period.
- Hover tooltips with the exact date and value for each bar.
Leaderboards
The Pro plugin registers 5 subscription leaderboards in the WooCommerce Analytics Overview page. Leaderboards appear in the existing WooCommerce leaderboard section and respect the date range picker.
Top Subscription Products — Active
Ranks products by how many active subscriptions they have.
| Column | Description |
|---|---|
| Product Name | Linked to the product edit screen |
| Active Subs | Count of active subscriptions for this product |
| MRR Contribution | Normalized monthly revenue from this product's active subscriptions |
Top Subscription Products — Revenue
Ranks products by total order revenue from orders containing subscription products.
| Column | Description |
|---|---|
| Product Name | Linked to the product edit screen |
| Total Revenue | Sum of line item totals from completed/processing orders |
| Orders | Number of distinct orders containing this product |
Top Subscribers — Lifetime Value
Ranks customers by total store spending across all completed orders.
| Column | Description |
|---|---|
| Customer | Display name, linked to the Manage Members detail page |
| Active Subs | Number of currently active subscriptions |
| Total Spent | Lifetime order total across all completed/processing orders |
Top Cancellation Reasons
Ranks the most common reasons customers give when cancelling.
| Column | Description |
|---|---|
| Reason | The cancellation reason text |
| Count | Number of times this reason was selected |
| % of Total | Percentage of all cancellations in the period |
Highest Churn Products
Ranks products by cancellation volume and churn rate.
| Column | Description |
|---|---|
| Product Name | Linked to the product edit screen |
| Cancellations | Number of cancelled subscriptions for this product |
| Churn Rate | Cancellation rate as a percentage for this product |
Real-Life Use Cases
Weekly Business Review
A store owner opens WooCommerce → Analytics → Overview every Monday and sets the period to Last Week. The performance cards show MRR growth, new subscriptions, and churn at a glance. They switch to the Net Subscription Growth chart to confirm the business is growing faster than it's losing subscribers.
Identifying a Churn Spike
A merchant notices the Churn Rate card showing a +40% delta versus the previous period. They click the card to jump to Retention Analytics, where they discover a specific cancellation reason ("Too expensive") spiking. They respond by creating a retention discount offer targeting that reason.
Evaluating Trial Performance
A SaaS store running a 14-day free trial checks the Trial Conversions card weekly. When the rate drops below 60%, they review the Top Cancellation Reasons leaderboard to see if trial users are citing a specific barrier, then adjust onboarding emails or trial length accordingly.
Edge Cases and Important Notes
- Revenue at Risk has no previous-period comparison. It is a real-time snapshot of MRR currently at risk, not a period-over-period metric. The delta is always shown as 0%.
- Active count uses start date filtering. A subscription is counted as active at a given point in time only if its
_start_dateis on or before that date and it hasactivestatus. Subscriptions created after the period end are excluded. - MRR includes trial subscriptions. Subscriptions in trial status contribute to MRR because they represent committed recurring revenue once the trial converts.
- Leaderboard data respects date filters. Revenue-based leaderboards filter by order creation date. Active-based leaderboards filter by subscription start date. Cancellation leaderboards filter by retention log timestamps.
- Cache invalidation is event-driven. If you manually edit subscription or order data directly in the database, the cache may show stale data for up to 1 hour. Normal admin operations trigger immediate cache invalidation.
Related Guides
- Reports Hub — Central directory of all analytics and data screens.
- Retention Analytics — Churn reasons, retention offer effectiveness, and trend charts.
- WooCommerce Analytics Extension — Subscription filters and metrics in WC Analytics reports.
- Order List Enhancements — Type columns and filters on the WooCommerce Orders page.
- Lifecycle Management — Status transitions that drive churn and renewal metrics.
- General Settings — Grace period and renewal timing configuration.
FAQ
Where do I find this dashboard?
Navigate to WooCommerce → Analytics → Overview (or WooCommerce → Analytics and select the Overview/Home tab). The subscription sections appear automatically when ArraySubs Pro is active.
Can I change the date range?
Yes. The dashboard respects the WooCommerce Admin date picker at the top of the page. You can select preset periods (Today, This Week, This Month, This Quarter, This Year) or set a custom date range.
Why does my MRR seem higher than expected?
MRR includes both active and trial subscriptions. If you have a large number of trials, their recurring amounts are counted because they represent potential committed revenue. To see MRR from active subscriptions only, cross-reference with the Active Subscriptions count.
Why is the Churn Rate showing 0%?
If no subscriptions were cancelled in the selected period, the churn rate is 0%. Also check that your date range is long enough — a single-day view may not capture any cancellation events.
What does "vs previous period" mean?
Each metric compares the selected date range against an equal-length period immediately before it. For example, if you view April 1–15, the comparison period is March 17–31. This lets you spot trends without manually switching dates.
Do leaderboards include variable product variations?
Yes. Leaderboards group by the effective product — if a subscription is tied to a specific variation, that variation appears in the ranking. If no variation is set, the parent product is used.
How does the trial conversion rate handle ongoing trials?
Only trials whose _trial_end_date falls within the selected period are counted. Trials still in progress are excluded because they haven't reached their conversion checkpoint yet.